
What's in my trash? ›
A collaborative project between the Center for Urban Science and Progress, the Downtown Brooklyn Partnership and the World Science Festival
‘What’s in my trash?’ is a waste characterization study done in collaboration between the Downtown Brooklyn Partnership, the Center for Urban Science and Progress and the World Science Festival. This study focused on public waste in downtown Brooklyn specifically in the Fulton Mall area which is a retail district that has high rates of pedestrian traffic. The aim of the ‘What’s in my trash?’ study was to:
- Analyze and quantify the contents of public waste;
- Evaluate the effectiveness of the newly placed recycle bins by the Department of Sanitation.
- Solicit public participation both through participation during the World Science Festival Science Hackday and through online participation following the World Science Festival;
The Downtown Brooklyn Partnership(DBP) is a non-for-profit local development corporation that manages three business improvement districts, MetroTech BID, Fulton Mall Improvement Association, and Court-Livingston-Schermerhorn BID. Amongst other responsibilities, DBP is chartered to provide supplemental waste collection services throughout the three BIDs and has contracted with the Doe Fund to provide these services. This servicing includes over 300 public waste baskets and fifty blue and green recycle bins which are collected daily and taken to a waste transfer station operated by the New York City Department of Sanitation.
 The World Science Festival Science Hackday is an opportunity to bring people together to explore urban science through building and developing ‘hacks’ over the course of a weekend. Held in NYU Poly’s MAGNET space in Downtown Brooklyn, the event also included a ‘Citizen Science Explorers Program’ allowing attendees to actively participate in existing research happening over the course of the weekend. The ‘What’s in my trash’ study was a components of the Citizen Science Explores Program.
Study Methods
The ‘What’s in my trash’ study took place on the second day of the World Science Festival Science Hackday. Prior to the study and working with the Downtown Brooklyn Partnership(DBP), we identified Fulton Street in downtown Brooklyn as the location to collect waste from the public waste baskets. This location provided sufficient foot traffic and continuity between the type of waste expected from multiple bins. The loading dock behind NYU Poly near the Metrotech commons was decided to be the location of the audit due to its openness to the public while still being located in a contained area.
On Saturday evening, the Doe Fund collected 35 trash bags. Ten bags were taken from the green recycling baskets representing the mixed paper and cardboard, ten bags were taken from the blue recycling baskets representing plastic, glass and metal recycling and fifteen bags were collected from the waste baskets which represent waste going to landfills. Given the time restrictions of the event, we understood that the sample of waste taken and analyzed would only represent a small sample of the total waste produced and collected. Though thirty-five bags were collected from the public, only ten bags were able to be analyzed which includes 4 green bags, 5 blue bags and 1 trash bag.
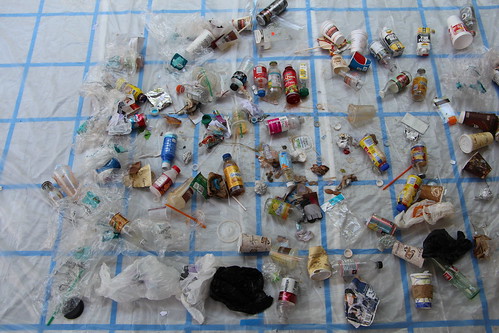
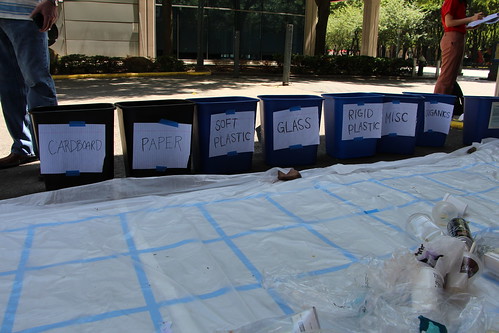 The procedures and methodology for this study were based on the waste characterization studies conducted by New York University in 2008 and replicated in 2014(in progress). Each trash bag was weighed prior to examination and then spaced out onto a gridded tarp in order to take an overhead photo allowing for online participation after the event(to be discussed later). The waste was then sorted into eight different categories, paper, hard plastic, soft plastic, cardboard, glass, metal, organics and miscellaneous. The miscellaneous category represented objects in which material makeup was not clear. Once the entire trash bag’s contents had been sorted, each bin was then weighed individually.
Challenges
The ‘What’s in my trash’ study faced several challenges, some as a result of the design of the study and some in part because of practical challenge arising during the analysis. Given the short time period(approx 11am-4pm), the ability to analyze a representative sample was challenging. The Downtown Brooklyn Partnership reported 2.5 tons of waste collected in 2013. As such our sample represents just seven ten-thousandths of the total.
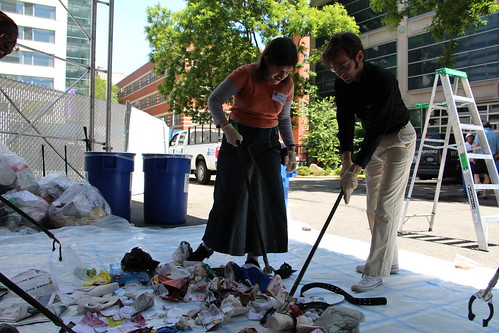
 The contents of the landfill trash bags, compared to the recycling bags, was significantly more difficult to sort as well as much less appealing to public participants. The first and only landfill trash bag that was analyzed contained black latex gloves, ink canisters and needle packaging suggesting the illegal dumping of medical waste into the public waste bins. Though participation in the sorting process was done with mechanized grabbers and not entirely by hand, the discovery stymied the morale of the public. Furthermore, the increased repugnance of the waste required more time for component identification and sorting and it was therefore decided to focus only on the recycling bags.
Finally, the study did not provide any type of training for the public as to proper identification of material type. On several occasions, a group discussion ensued as to which bin a certain item should be placed. Based on this observation, it is likely that accuracy with which everything was sorted may not be 100%.
Public Participation
Attendees of the World Science Festival Science Hackday were solicited for help in the study. Approximately fifteen people participated periodically throughout the event with several others passing by and observing. Participants wore protective gloves and masks (if desired) while also using a mechanized trash picker.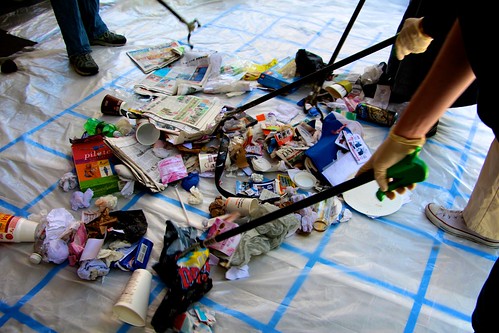
To include a larger audience and generate an alternative data stream, an online component to the project is currently being developed and deployed. Online participation will take place by placing overhead images of the separated waste online using the platform Crowdcrafting.org. Online participants will be asked to identify items in the image to compliment the data obtained thus far.
Results and Discussion
The following depicts the total weights collected:
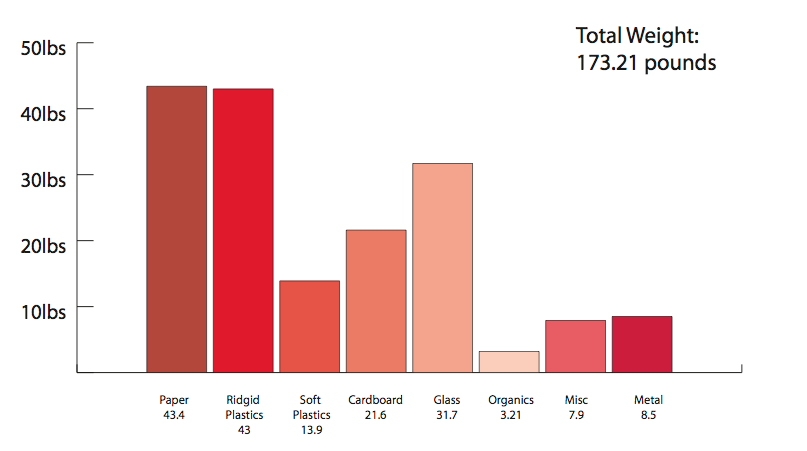
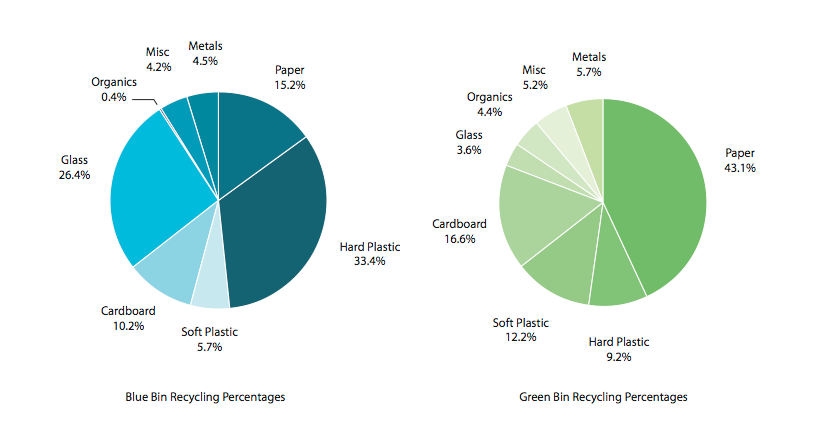
FIGURE 2 shows the breakdown of the content’s weight for both the green and blue recycle bins. The green bins were 59.7%% comprised of the materials designated for the bin(43.1% paper and 16.6% cardboard) while 12.2% was soft plastic and 9.2% was rigid plastics. The blue bin on the other hand was comprised of 64.3% expected material(33.4% hard plastic, 26.4% glass and 4.5% metal). Of the remaining material in the blue bin, 25.4% was paper and cardboard.
It is also important to note the finding of trace amounts of medical waste while exploring the first landfill bag. Though this study fails to produce significant data suggesting rampant illegal dumping, illegal seems quite likely given the immediate discovery and repeated peripheral accounts from the DBP.
Conclusion
The combination of incorporating the public into a waste characterization study over the course of an afternoon is extremely challenging. On the one hand, the resulting data faces several challenges related to validity, while on the other hand public involvement creates a profound impact. Participation in ‘What’s in my trash?’ could have been greater but there is no doubt, given the responses of the participants, that experimenting and exploring the waste audit left a significant impact. It would be advisable for future studies, if the goal is solely data collection, to separate the data collection and public participation. However, the impact of incorporating the public, though challenging to measure, is indeed an important component and should be included into other waste characterization studies.