
EcoHack: Landfill Club ›
EcoHack is about using technology to improve and better understand our natural environment, creating things that will have an impact, with no restrictions on how you get there.
In the past, EcoHack has hosted everything from creating data visualizations to building kites. We've seen people crack open a scientific database of plant species and we've seen people try build maps to help share news about forest loss. The format is flexible, the outcomes are meaningful, and the weekend is fun!
This year at EcoHack, a group of data enthusiasts began to explore data concerning landfills throughout the United States. The day began with conversations surrounding data validity and sources of data which are sparse. We did, however, discover that some states keep excellent records regarding landfills 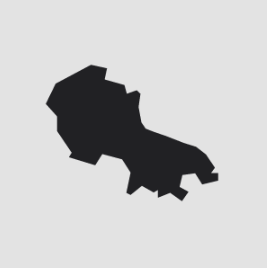 while others lack. For example, the state of California has tonnage records dating back to 1990 which can be accessed online.
The EPA on the other hand, has an abundance of data which several people during the day began to explore. One of the greatest challenges with this exploration is the fact that there is no programmable means of accessing this data. The EPA has web services and a REST services but we were unable to get this to work. This is unfortunate because it forces researchers to manually download data sets from their database which is not only time consuming but prevents any type of visualization to be realtime. If the EPA updates, one row or column in their data, then the researcher must go back and redownload the data.
The EPA does state that they are upgrading their database and have recently released a version 2.1 which has better search features and is another step in their roadmap to deploy a full (and working) API.
Other researchers throughout the day discovered previous reporting on landfills in particular related to the largest landfill in the world. The images of these landfills were widely discussed and presented a great deal of other questions. One of the primary questions is how big are these landfills? How can we relate  to the size? Are they the size of New York City or the size of Rhode Island?
Another data source we found were waste incinerators throughout the country. This data is supplied also from the EPA but we used enigma.io in order to find and work with the data.
Finally, serval hackers spent a great deal of time working on data about landfill size that was being created by the public. This data was taken from a Crowdcrafting.org app titled Landfill Hunter. This app asks people to look at a map and outline any visible landfill in the area. With this outline, the total area of the landfill is then calculated and stored. This data can then be exported in json or csv format. Beginning with this data in the morning, we realized not all of the data was constructed properly. As such, several researchers prepared a python script which would re-organize the data appropriately.
One the data was cleaned, serval people began to build a profile page for each landfill ordered by size. This was a very interesting approach to be able to visualize landfills not only by their shape but also by their size. This visualization, however, only accounts for around 5% of the total landfills in the country. This is a result of pending tasks in the Crowdcrafting application. Once all of the data collection is complete, this visualization will be completed.
Official site: http://landfill.club.
Github Repo: https://github.com/tholex/trashviz
Titan Pad: http://titanpad.com/8efVBMrPTe
Participants:
Olex Ponomarenko, Jonathan Levy, Nicholas Johnson, Kim Fisher, Elliott Walker, Emily Sturdivant, Josselin Philippe